In 2013, 284 students graduated from the College of Law*. Of those students, 282 (99.3%) provided information in response to the graduate employment surveys. Not all graduates shared salary information or provided answers to all survey questions.
For the Class of 2013, 80% of DePaul Law graduates seeking employment reported being employed as of nine months after graduation. This percentage includes graduates reporting being employed in positions classified by the ABA as: bar passage required, JD advantage, professional, non-professional and undetermined.
The employment statistics requested by the ABA and NALP, and provided here, include all employment, whether it is in the legal industry or in non-legal sectors, and also include full-time, part-time, long-term or short-term employment. Also included are those graduates who were not seeking employment, were holding deferred employment offers, enrolled in full-time degree programs, or were of unknown employment status.
Additional employment information for the Class of 2013 can be found in the 2014 ABA Placement Report.
*The figures reported for the Class of 2013 include those students graduating in May 2013, July 2013, and December 2012 (per NALP guidelines).
Employment Status & Job Type
Employment Status 9 Months After Graduation
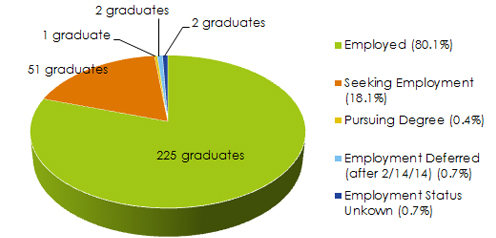
Data from ABA Employment Summary for 2013 Graduates; 3 graduates reported not seeking employment.
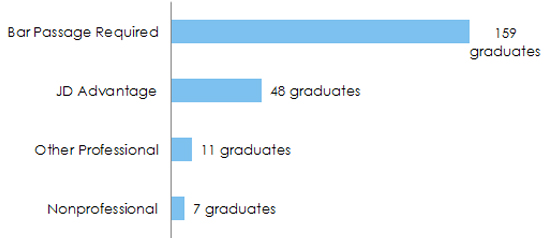
Employment by Job Type

Data from Class of 2013 NALP Summary Report.
Employment by Job Category
Data from Class of 2013 NALP Summary Report.
Duration of Employment Status
| Bar Passage Required |
132 |
8 |
10 |
9 |
159 |
55.99 |
| JD Advantage |
34 |
3 |
8 |
3 |
48 |
16.9 |
| Professional Position |
9 |
2 |
0 |
0 |
11 |
3.87 |
| Nonprofessional Position |
1 |
0 |
4 |
2 |
7 |
2.46 |
Data from ABA Employment Summary for 2013 Graduates.
Government Positions
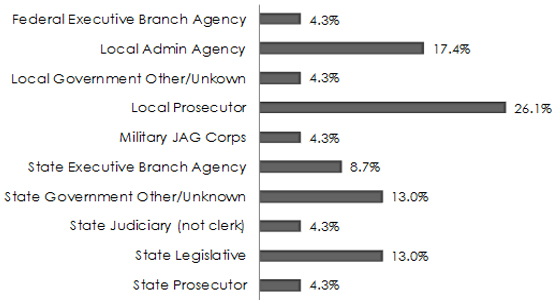
Data from Class of 2013 NALP Summary Report; 23 graduates reported employment in government positions.
Business Positions
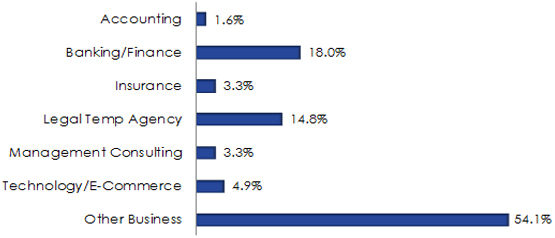
Data from Class of 2013 NALP Summary Report; 61 graduates reported employment in business positions.
Other Positions by Type
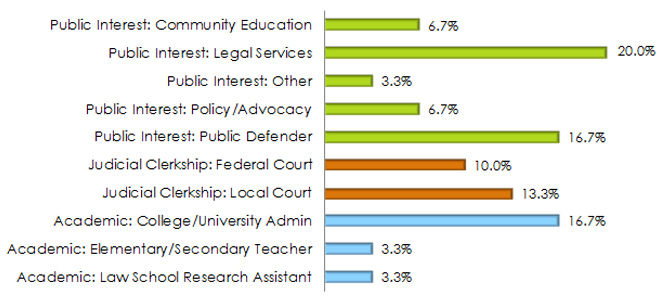
Data from Class of 2013 NALP Summary Report; 16 graduates reported employment in public interest positions, 7 in judicial clerkships, and 7 in academic positions.
Salary Information
Salary by Sector
| Salary by Sector |
Graduates Reporting Employment |
Graduates Reporting Salary |
25th Percentile |
Median |
75th Percentile |
| Private Sector |
172 |
94 |
$50,000 |
$65,000 |
$80,000 |
| Public Sector |
53 |
28 |
$43,000 |
$50,500 |
$59,340 |
Data from Class of 2013 NALP Summary Report. Only full-time, long-term reported salaries are included.
Employment by Job Category
| Type of Employer |
Number Reported |
Number Reported w/Salary |
25th Percentile |
Median |
75th Percentile |
| Academic |
7 |
0 |
- |
- |
- |
| Business |
61 |
29 |
$50,000 |
$65,000 |
$72,000 |
| Judicial Clerk |
7 |
6 |
$44,656 |
$54,451 |
$62,909 |
| Private Practice |
111 |
65 |
$50,000 |
$60,000 |
$85,000 |
| Government |
23 |
12 |
$50,500 |
$55,075 |
$59,340 |
| Public Interest |
16 |
8 |
$35,625 |
$44,000 |
$49,500 |
| Unknown |
2 |
- |
- |
- |
- |
Data from Class of 2013 NALP Summary Report. Only full-time, long-term reported salaries are included. (A minimum of 5 reported salaries is required for each salary analysis.)
Employment by Law Firm Size & Salary
| Size of Firm |
Percent of Reported |
Number Reported |
Number Reported w/Salary |
25th Percentile |
Median |
75th Percentile |
| 2-10 attorneys |
54.1% |
60 |
32 |
$43,500 |
$50,000 |
$61,250 |
| 11-25 attorneys |
16.2% |
18 |
11 |
$57,000 |
$60,000 |
$70,000 |
| 26-50 attorneys |
4.5% |
5 |
- |
- |
- |
- |
| 51-100 attorneys |
4.5% |
5 |
- |
- |
- |
- |
| 101-250 attorneys |
4.5% |
5 |
5 |
$85,000 |
$85,000 |
$100,000 |
| 251-500 attorneys |
0.9% |
1 |
- |
- |
- |
- |
| 501+ attorneys |
9.0% |
10 |
9 |
$100,000 |
$150,000 |
$160,000 |
| Solo Practice |
3.6% |
4 |
- |
- |
- |
- |
| Unknown Size |
2.7% |
3 |
- |
- |
- |
- |
Data from Class of 2013 NALP Summary Report. (A minimum of 5 reported salaries is required for each salary analysis.)
Employment Location
Number of Jobs Reported by Region/State
|
Region/State |
# of Jobs |
|
New England |
1 |
| Connecticut |
1 |
| |
|
|
Mid-Atlantic |
4 |
| New Jersey |
1 |
| New York |
3 |
| |
|
|
East North Central |
199 |
| Illinois |
191 |
| Michigan |
6 |
| Wisconsin |
2 |
| |
|
|
West North Central |
3 |
| Minnesota |
1 |
| Missouri |
2 |
| |
|
|
South Atlantic |
6 |
| Florida |
2 |
| Virginia |
4 |
| |
|
|
East South Central |
4 |
| Kentucky |
4 |
| |
|
|
West South Central |
3 |
| Texas |
3 |
| |
|
|
Mountain |
3 |
| Colorado |
2 |
| Nevada |
1 |
| |
|
|
Pacific |
2 |
| California |
1 |
| Washington |
1 |
Data from Class of 2013 NALP Summary Report.