In 2011, 319 students graduated from the College of Law*. Of those students, 308 (96.6%) provided information in response to the graduate employment surveys. Not all graduates shared salary information or provided answers to all survey questions.
For the Class of 2011, 78.3% of all graduates seeking employment reported being employed as of nine months after graduation. This figure excludes graduates who reported that they were not seeking employment at the time of the survey, graduates enrolled in a full-time degree program, and graduates whose status was unknown. The employment statistics requested by the ABA and NALP, and provided here, include all employment, whether it is in the legal industry or in non-legal sectors, and also include full-time, part-time, long-term or short-term employment.
Additional employment information for the Class of 2011 can be found in the
2012 ABA Placement Report.
* The figures reported for the Class of 2011 include those students graduating in May 2011, July 2011, and December 2010 (per NALP guidelines).
Employment Status & Job Type
Employment Status 9 Months After Graduation
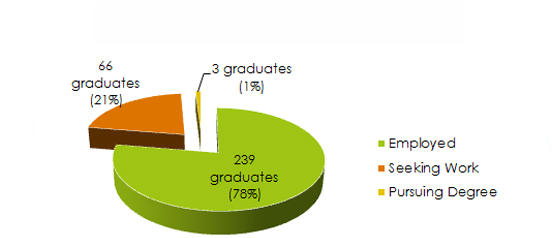
Data from 2011 NALP Summary Report. The figures above exclude the 11 graduates whose status was unknown.
Employment by Job Type
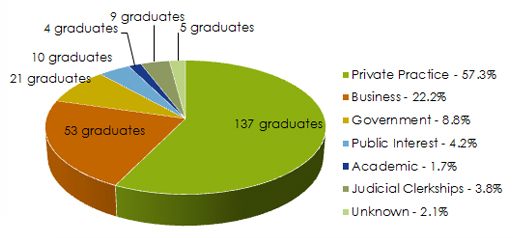 Data from 2011 NALP Summary Report.
Full-Time, Part-Time Status by Job Type
| Job Type |
Full-time |
Part-time |
| Academic |
4 |
0 |
| Business |
34 |
15 |
| Judicial Clerkship |
9 |
0 |
| Law Firm |
107 |
15 |
| Government |
17 |
2 |
| Public Interest |
8 |
2 |
| Unknown |
1 |
1 |
Data from 2011 NALP Summary Report. 24 employed graduates did not specify part-time or full-time status.
Employment by Job Category
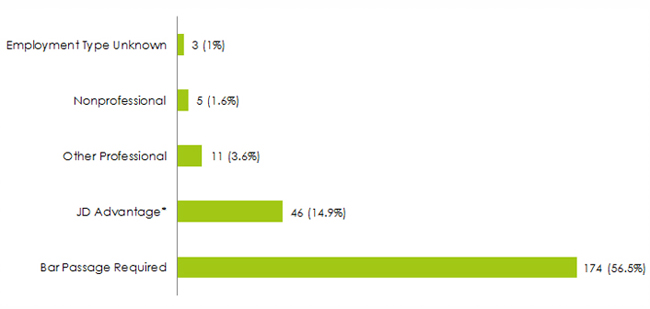
Data from 2011 NALP Summary Report.
*The ABA defines a job of this type as one for which a JD is required or preferred; it may also include a job for which the JD degree provides a demonstrable and significant advantage in obtaining or performing the job, even when that job does not involve the practice of law in a direct fashion.
Government Positions
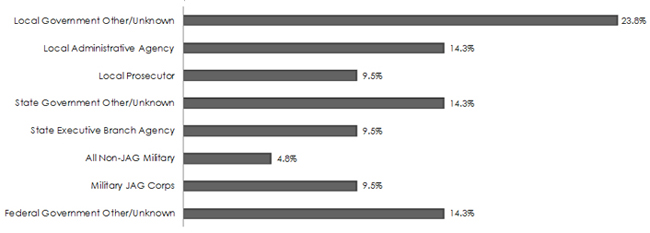
Data from 2011 NALP Summary Report. 21 graduates reported employment in government positions.
Business Positions
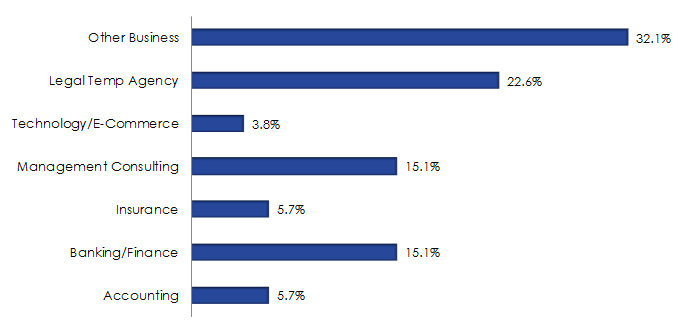
Data from 2011 NALP Summary Report. 52 graduates reported employment in business positions.
Other Positions by Type
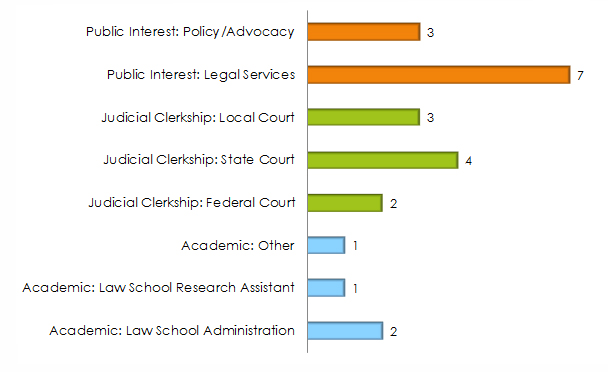
Data from 2011 NALP Summary Report. 10 graduates reported employment in public interest positions, 9 in judicial clerkships, and 4 in academic positions.
Salary Information
Salary by Sector
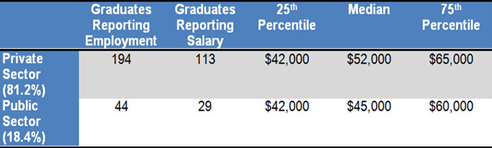
Data from 2011 NALP Summary Report. 1 graduate reported being employed but did not provide employment information. Of those graduates reporting employment, 142 graduates provided salary information.
Employment by Job Category
| Type of Employer |
Number Reported |
Reported w/Salary |
25th Percentile |
Median |
75th Percentile |
| Academic |
4 |
0 |
- |
- |
- |
| Business |
53 |
18 |
$60,000 |
$64,500 |
$74,000 |
| Judicial Clerk |
9 |
9 |
$42,000 |
$58,700 |
$63,000 |
| Private Practice |
137 |
82 |
$40,000 |
$50,000 |
$65,500 |
| Government |
21 |
14 |
$43,000 |
$54,120 |
$60,000 |
| Public Interest |
10 |
5 |
$40,000 |
$42,000 |
$45,000 |
| Unknown |
5 |
0 |
- |
- |
- |
Data from 2011 NALP Summary Report. The figures reported above are based on the full-time, long-term salaries.
Employment by Law Firm Size & Salary
| Size of Firm |
Percent of Reported |
Number Reported |
Number Reported w/Salary |
25th Percentile |
Median |
75th Percentile |
| 2-10 attorneys |
60.6% |
83 |
45 |
$40,000 |
$45,000 |
$52,000 |
| 11-25 attorneys |
10.9% |
15 |
9 |
$40,000 |
$50,000 |
$70,000 |
| 26-50 attorneys |
10.9% |
15 |
11 |
$45,000 |
$70,000 |
$85,000 |
| 51-100 attorneys |
3.6% |
5 |
5 |
$65,000 |
$145,000 |
$150,000 |
| 101-250 attorneys |
2.9% |
4 |
- |
- |
- |
- |
| 251-500 attorneys |
1.5% |
2 |
- |
- |
- |
- |
| 501+ attorneys |
6.6% |
9 |
7 |
$100,000 |
$125,000 |
$150,000 |
| Solo Practice |
0.7% |
1 |
- |
- |
- |
- |
| Unknown Size |
2.2% |
3 |
- |
- |
- |
- |
Data from 2011 NALP Summary Report.
Employment Location
Number of Jobs Reported by State
|
State |
# of Jobs |
| Massachusetts |
1 |
| New Jersey |
1 |
| Pennsylvania |
1 |
| Illinois |
186 |
| Indiana |
3 |
| Michigan |
3 |
| Ohio |
3 |
| Wisconsin |
3 |
| Iowa |
1 |
| Minnesota |
2 |
| Missouri |
2 |
| Washington, D.C. |
2 |
| Florida |
2 |
| Georgia |
4 |
| Maryland |
2 |
| South Carolina |
1 |
| Virginia |
2 |
| Kentucky |
1 |
| Texas |
3 |
| Arizona |
2 |
| Colorado |
1 |
| Utah |
1 |
| California |
4 |
| Washington |
2 |
Data from 2011 NALP Summary Report.